Insights
Reports & stats
Where your money actually went over a chosen time period — totals, daily averages, and a trend chart you can drill into.
The Stats tab
The Stats tab is Flow's report room. At the top is a period picker and a granularity row (By month / More options). Below is the headline total, a trend chart for the selected period, and per-day averages. Everything is computed locally from your transactions — no server, no delay.
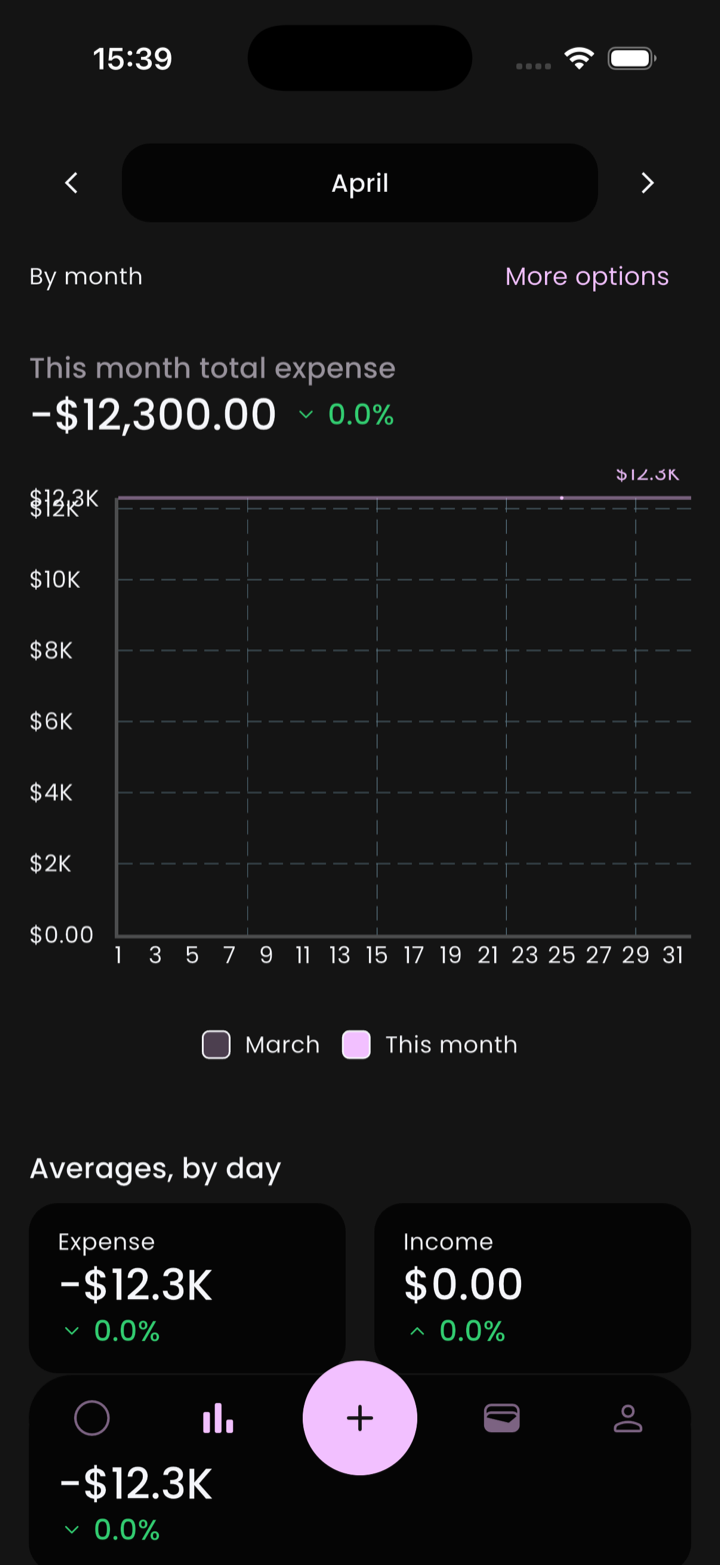
- By month / More options — change how the chart is sliced and what it includes.
- Headline total — total expense for the period, with a delta vs. the previous period.
- Trend chart — current period overlaid on the previous one for comparison.
- Averages, by day — Expense and Income cards summarizing the period's daily mean.
Picking a time period
The header shows the current period (e.g. April). Tap the ‹ › arrows on either side to step backward or forward — flick through every month of last year without re-picking dates. Tap the period name itself, or the More options link, to change granularity (week / month / year / custom range).
Drilling in
Tap a point on the trend chart, or one of the average cards, to drill down to:
- Just the transactions that contributed.
- A sub-breakdown by category or account.
From there you can tap any individual transaction to inspect or edit it. Drill, drill, drill until you find the one outlier expense that warped the chart.
Income vs. expense
The Averages, by day section splits the period into Expense and Income cards. Transfers are excluded from both by design — moving money between your own accounts isn't spending or earning.
Currency in reports
Reports are always rendered in your primary currency. Transactions in other currencies are converted at the latest exchange rate Flow has cached. If you need to see raw figures in their original currencies, drill down to the transaction list — individual transactions show their native currency.
ℹ️ Stale rates